Project Overview
This project uses a GARCH(1,1) model to forecast the future daily volatility of the Nasdaq Composite Index (^IXIC). The goal is to estimate how much price movement (volatility) to expect in the coming days, which is useful for risk management, trading strategies, and options analysis.
The project includes:
- Downloading daily Nasdaq data from Yahoo Finance
- Calculating log returns
- Fitting a GARCH(1,1) model
- Forecasting 30 days of volatility
- Comparing model forecasts with historical rolling volatility
- Wrapping the workflow into a reusable Python class
Key Outputs
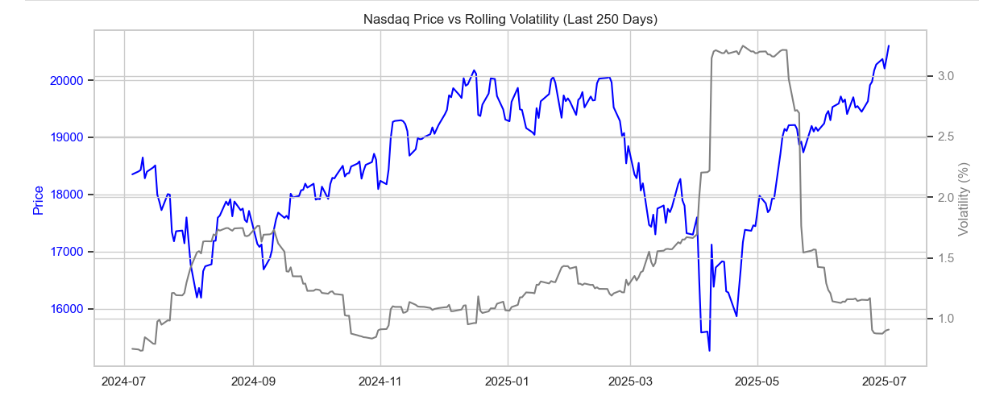
✅ Nasdaq Price vs. Rolling Volatility (Last 250 Days)
- Rolling 30-day volatility spikes during market drops.
- Calm price trends are usually matched by low volatility.
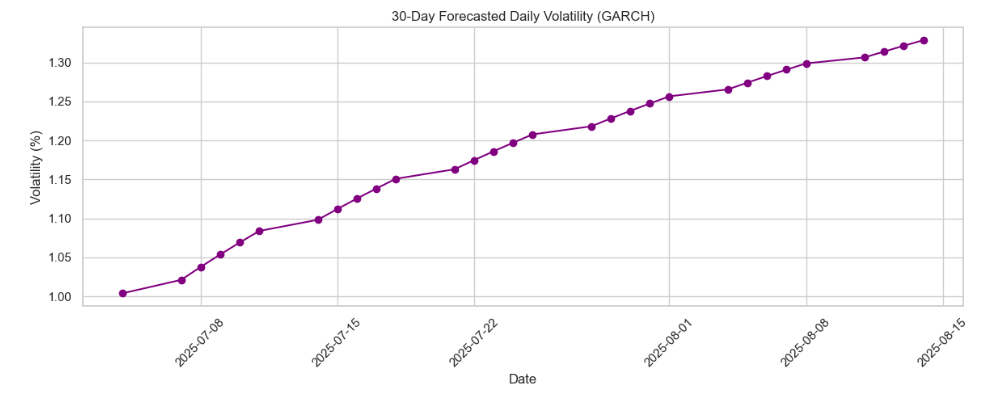
✅ 30-Day Forecasted Daily Volatility (GARCH)
The GARCH model captures persistence in volatility and forecasts a slight increase in the coming days:
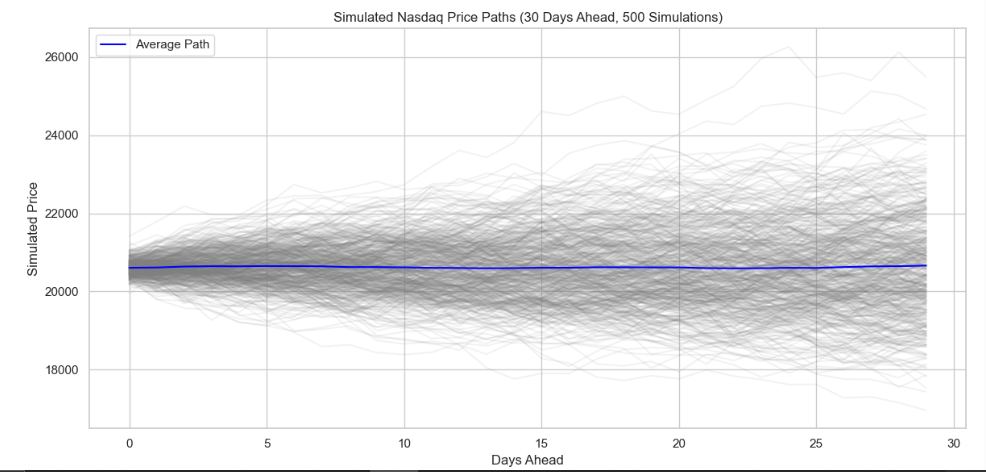
📊 Simulating Future Price Paths
Using the GARCH forecast, we simulated 500 possible future price paths to visualize the uncertainty over a 30-day horizon.
- Price paths are based on cumulative log returns with volatility scaling.
- The average path stays relatively flat (no return drift).
- The shaded region represents the 90% confidence band (5th to 95th percentile).
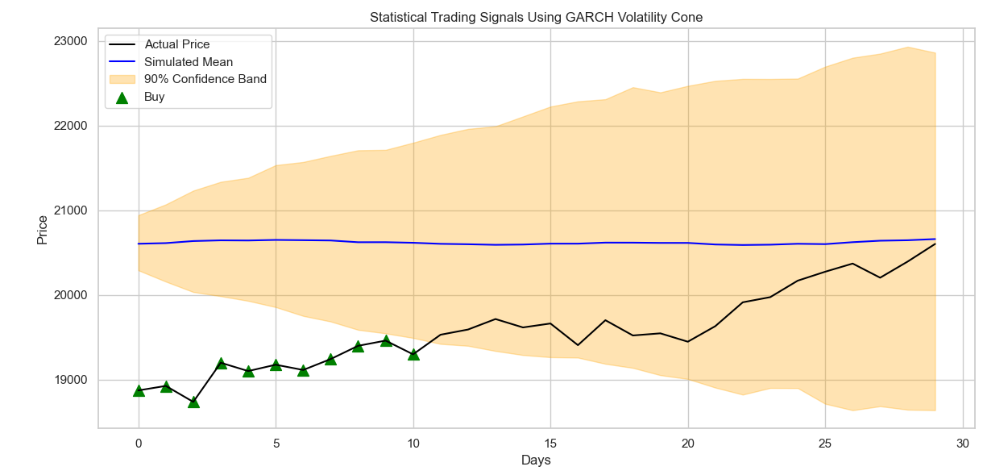
📈 Trade Signal Generation
We compared recent actual prices to the simulated volatility cone:
- Buy if actual price falls below the 5th percentile path.
- Sell if it exceeds the 95th percentile.
- Hold if it stays within.
This created a basic statistical trading rule based on extreme deviation from expected price movement.
Insights
- ✅ Most prices stayed inside the 90% cone - a sign that the GARCH forecast captured realistic risk.
- 📉 Only a few buy/sell signals were triggered - consistent with conservative statistical strategies.
- 🧠 Confidence intervals expand with time - showing how uncertainty grows in longer forecasts.
- 🔄 The approach is symmetric and agnostic to direction - it only reacts to large deviations, not trends.
How GARCH Helps in Trading
Volatility doesn’t predict direction, but it helps shape trading decisions:
- 📏 Position sizing: Reduce exposure in high-volatility environments
- 🧠 Risk management: Anticipate large moves during volatile periods
- 💸 Options trading: Use volatility expectations to choose strike prices or entry points
- ⚡ Breakout filters: Combine price and volatility to avoid whipsaws
Code Structure
The full workflow is encapsulated in a class:
model = GARCHForecaster("^IXIC")
model.download_data()
model.fit_model()
model.forecast_volatility(horizon=30)
model.plot_forecast()