This project explores a dataset of Nairobi property listings to uncover patterns in pricing based on location, property type, and features like bedrooms, bathrooms, and house size. The dataset was sourced from Kaggle and cleaned using pandas before performing exploratory data analysis (EDA) and predictive modeling.
🧹 Data Cleaning Summary
We performed the following steps:
- Removed currency symbols and converted prices to integers
- Renamed columns for clarity (
pricetoprice_in_ksh, etc.) - Corrected inconsistent entries (e.g.,
townhusetotownhouse) - Handled missing values:
- Filled missing
house_size_sqmusing the median bypropertytype
- Filled missing
- Dropped duplicate and unused columns
- Filtered extreme outliers
📊 Exploratory Data Analysis (EDA)
🔹 Average Price by Location
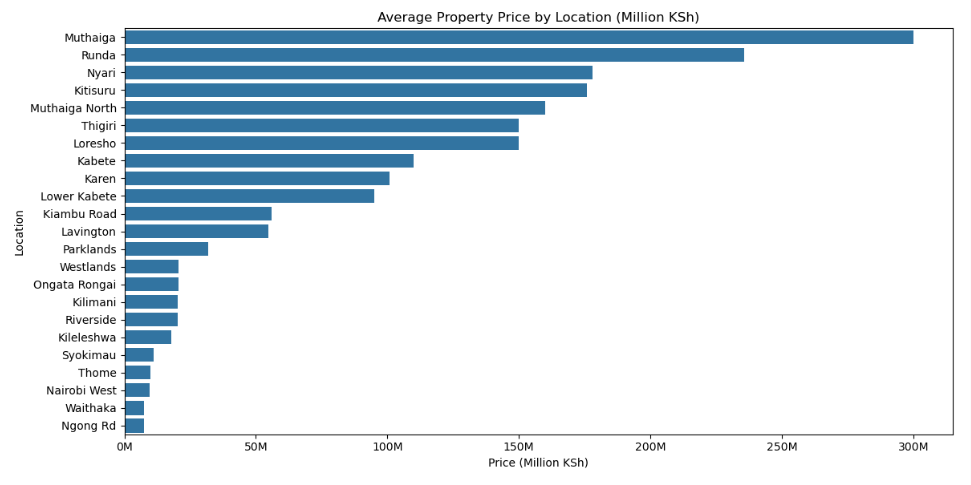
The most expensive neighborhoods were:
- Muthaiga
- Runda
- Nyari
- Kitisuru
- Muthaiga North
These are Nairobi’s diplomatic and high-income zones. Karen ranked 10th, likely due to a broader mix of property types and fewer listings in this sample.
🔹 Property Type and Price
- Townhouses had the highest average prices
- Apartments were the most common property type but less expensive
This shows that townhouses, while fewer, dominate the upper market segment.
🔹 Bedrooms vs. Price
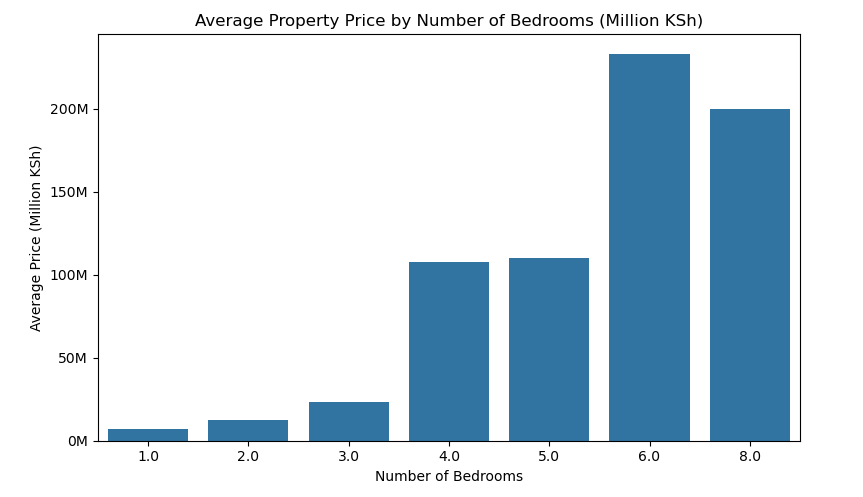
- Steady increase from 1 to 3 bedrooms
- Sharp jump at 4 bedrooms
- 4 and 5 bedrooms priced about the same
- 6 bedrooms saw a more than double increase
- 8 bedrooms were lower than 6, possibly due to listing variation
🔹 Bathrooms vs. Price
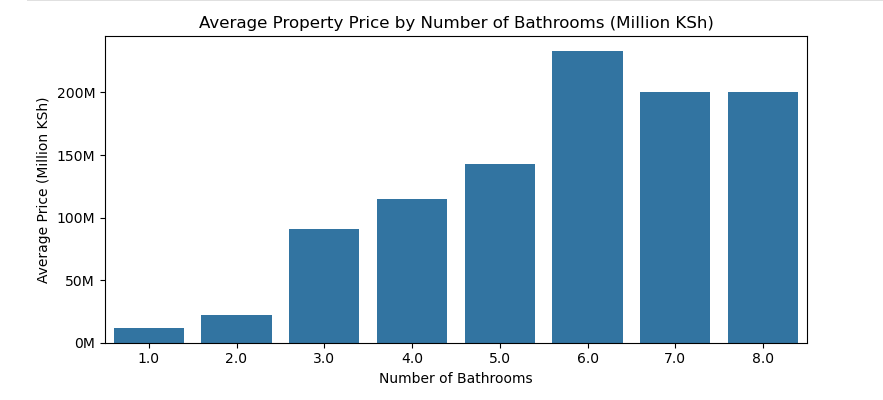
- Gradual rise from 1 to 2 bathrooms
- Sharp increase at 3 bathrooms
- Steady growth from 3 to 5
- 6 bathrooms showed another major price jump
- 7 and 8 bathrooms were lower than 6, likely due to sample size
🔹 Size vs. Price
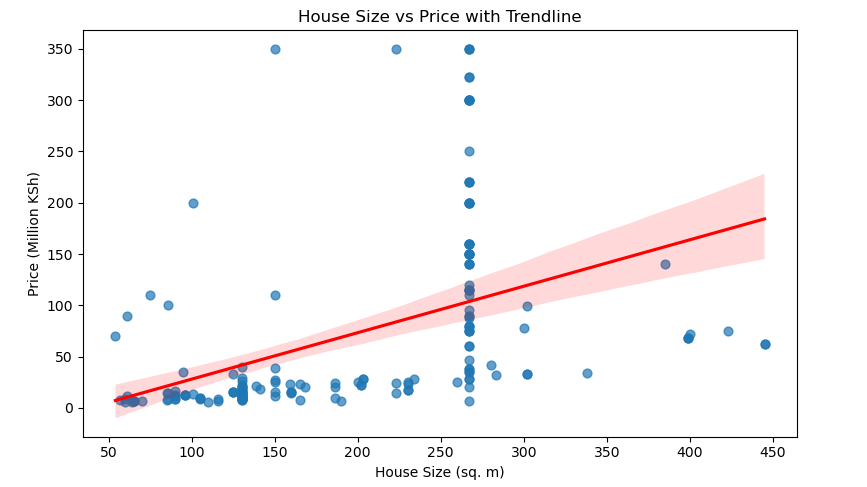
The regression line in the size vs. price scatter plot showed:
- Most homes are between 50–450 sqm
- Prices range from ~50 million to 150+ million KSh
- Larger homes command higher prices, but the relationship isn’t perfectly linear
🧠 Predictive Modeling
🎯 Goal
Use features like location, property type, bedrooms, bathrooms, and house size to predict property price.
📌 Baseline Model
- Baseline RMSE:
98.5M KSh - Baseline RMSE as % of mean price:
132.5%
📈 Ridge Regression
- RMSE:
89.6M KSh - RMSE as % of mean price:
120.5%
🌲 HistGradientBoostingRegressor (with log-transformed target)
- RMSE:
69.1M KSh - RMSE as % of mean price:
92.9%
This model performed best and was selected as the final model.
🔍 Feature Importance
Top predictors:
- Property type (townhouse, apartment)
- Location (Karen, Kiambu Rd, Kabete)
- House size in sqm
💡 Key Takeaways
- Property prices in Nairobi are highest in high-income zones like Muthaiga and Runda
- Bedroom and bathroom counts are strong indicators of price, especially beyond 4
- House size strongly correlates with price
- Non-linear models (like tree-based ones) perform better than linear models for this task
📓 Full Code Available
👉 View the Nairobi Real Estate Jupyter Notebook